
Small Business Checkpoint: striking a balance
Outstanding loan balances might put pressure on credit card use
Recent surveys suggest that rising small business loan balances are increasing due to firms slowing repayments rather than taking out new loans. The most recent Small Business Lending Survey from the Federal Reserve Bank of Kansas City showed outstanding small business commercial and industrial (C&I) loan balances increased year-over-year (YoY) for the first time since the first quarter of 2021, despite remaining stable in the last two quarters.
At the same time, the January 2024 Senior Loan Officer Opinion Survey found that banks continue to report a decrease in the number of inquiries from potential small business borrowers seeking new or increased credit lines. Higher outstanding loan balances, however, are likely to increase outlays for these firms, particularly as the actual interest rate paid on short-term loans by borrowers has risen, according to National Federation of Independent Businesses (NFIB) respondents (Exhibit 1).
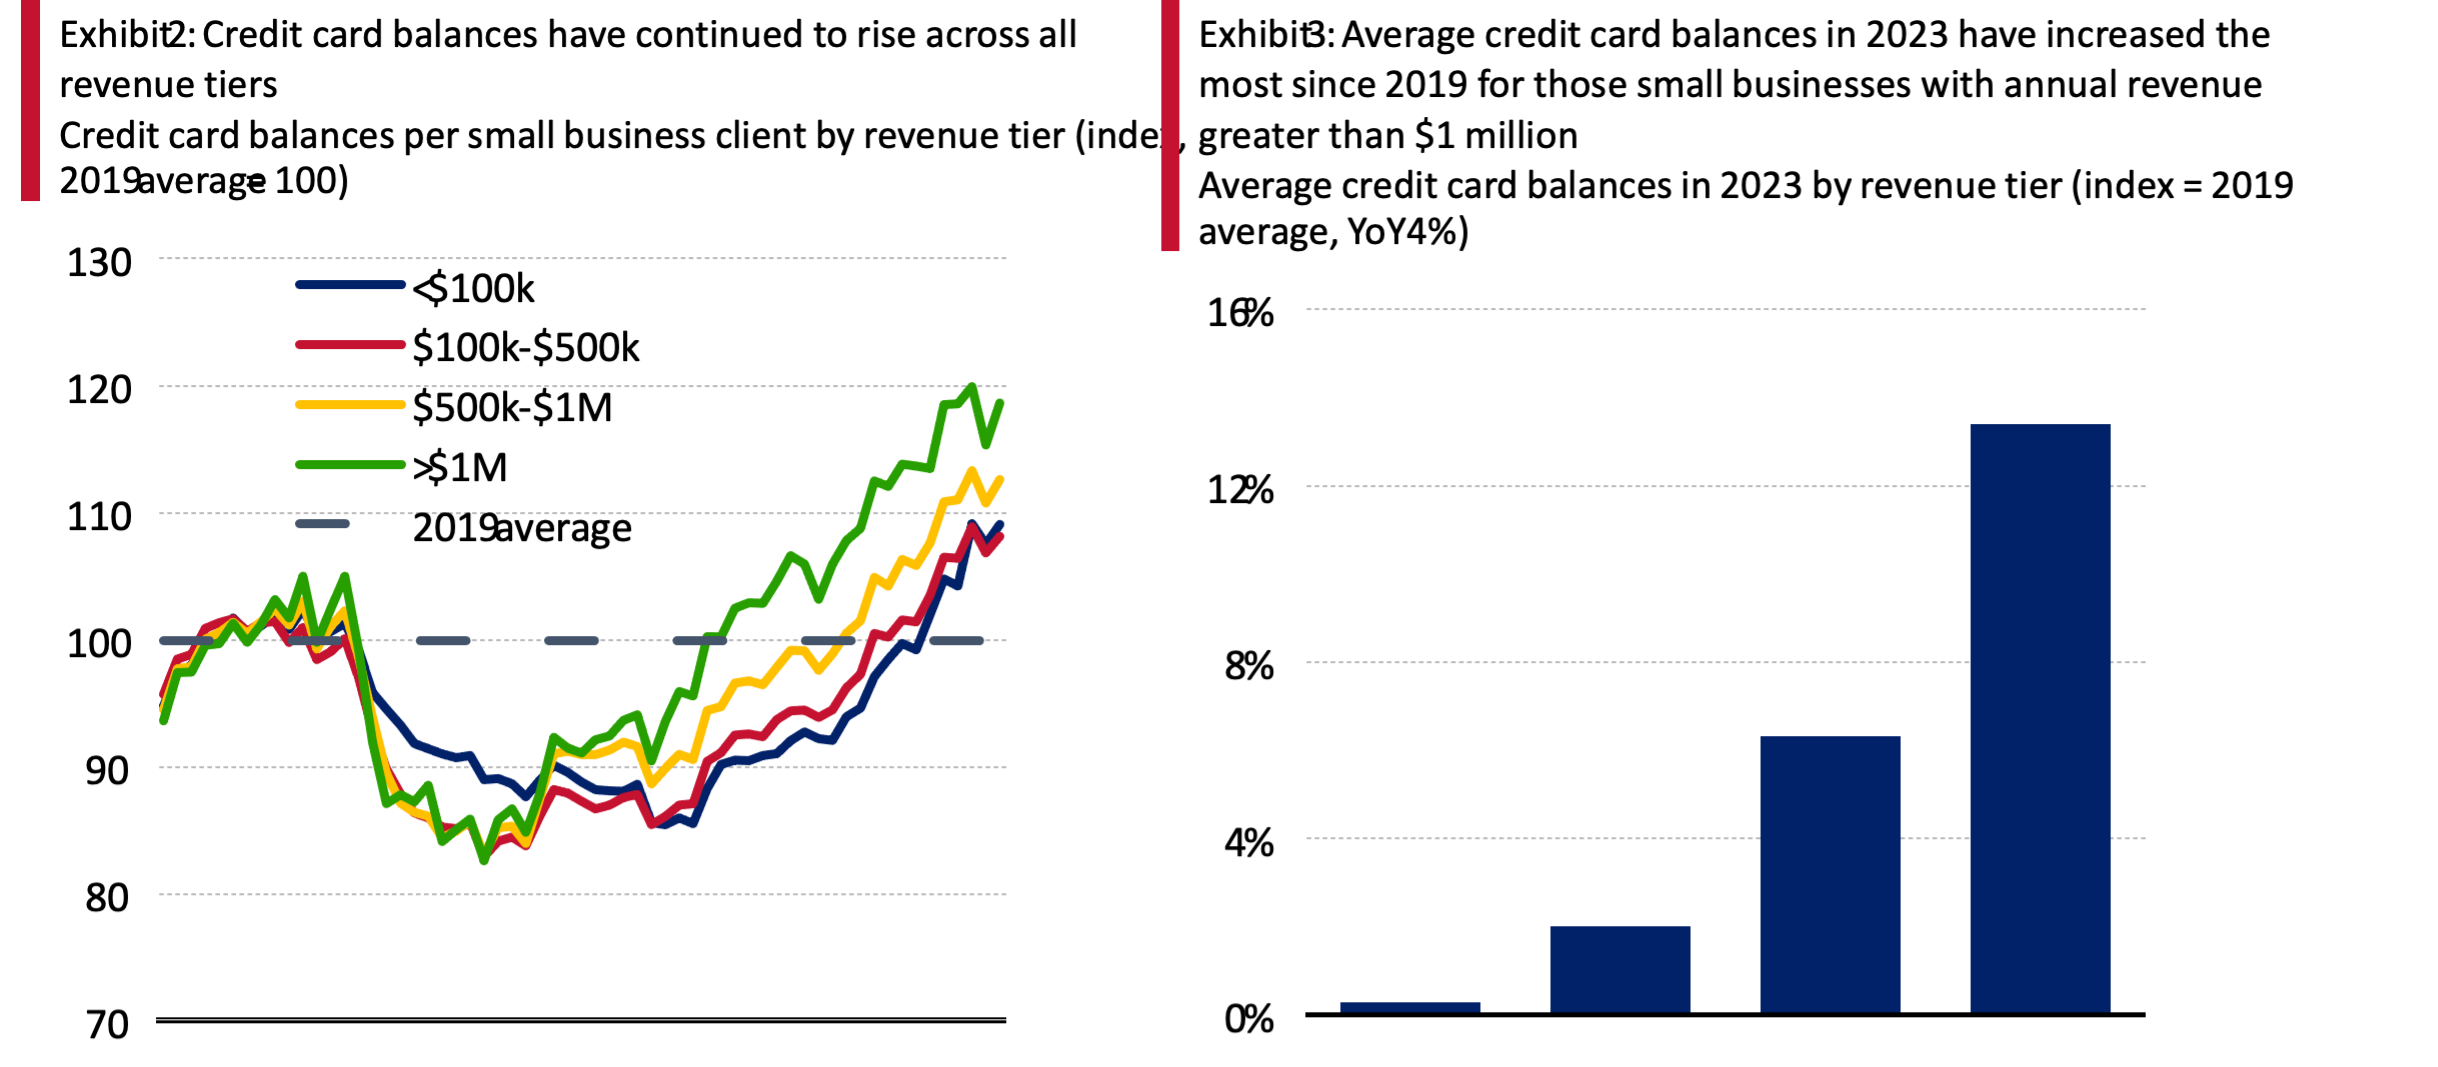
So, is this a sign small firms are challenged by higher interest rates and tighter credit? Maybe. Bank of America aggregated and anonymized small business credit card data signals small businesses are increasingly reliant on credit cards to finance their operations. As we explained in November, credit card spending has been largely flat since halfway through 2023 (Exhibit 1) and has even recently started to decline on a per client basis, yet, credit card balances have continued to rise (Exhibit 2). This suggests to us that more small businesses are using credit cards as source of financing this year with an increasing portion of balances carrying interest after a decline in this revolving behavior during and post-pandemic.
While some small businesses may be starting to feel financial pressure, two positive factors have emerged. First, the increase in credit balances on Bank of America small business accounts since 2019 has been lower than the rise in the Consumer Price Index (CPI) over the same period (around 19%). This is true across all revenue tiers. Accordingly, inflation-adjusted balances remain below pre-pandemic levels, even for the largest small businesses (annual revenue greater than $1 million). The average balance for these companies increased by approximately 13% in 2023 compared to the 2019 average (Exhibit 3).
STRONG DEPOSIT LEVELS OFFER SUPPORT
Bank of America internal data also reveals positive signs when we consider the asset side of small business balance sheets.
Small businesses’ liquid assets in the form of deposit levels appear relatively strong, according to Bank of America internal data.
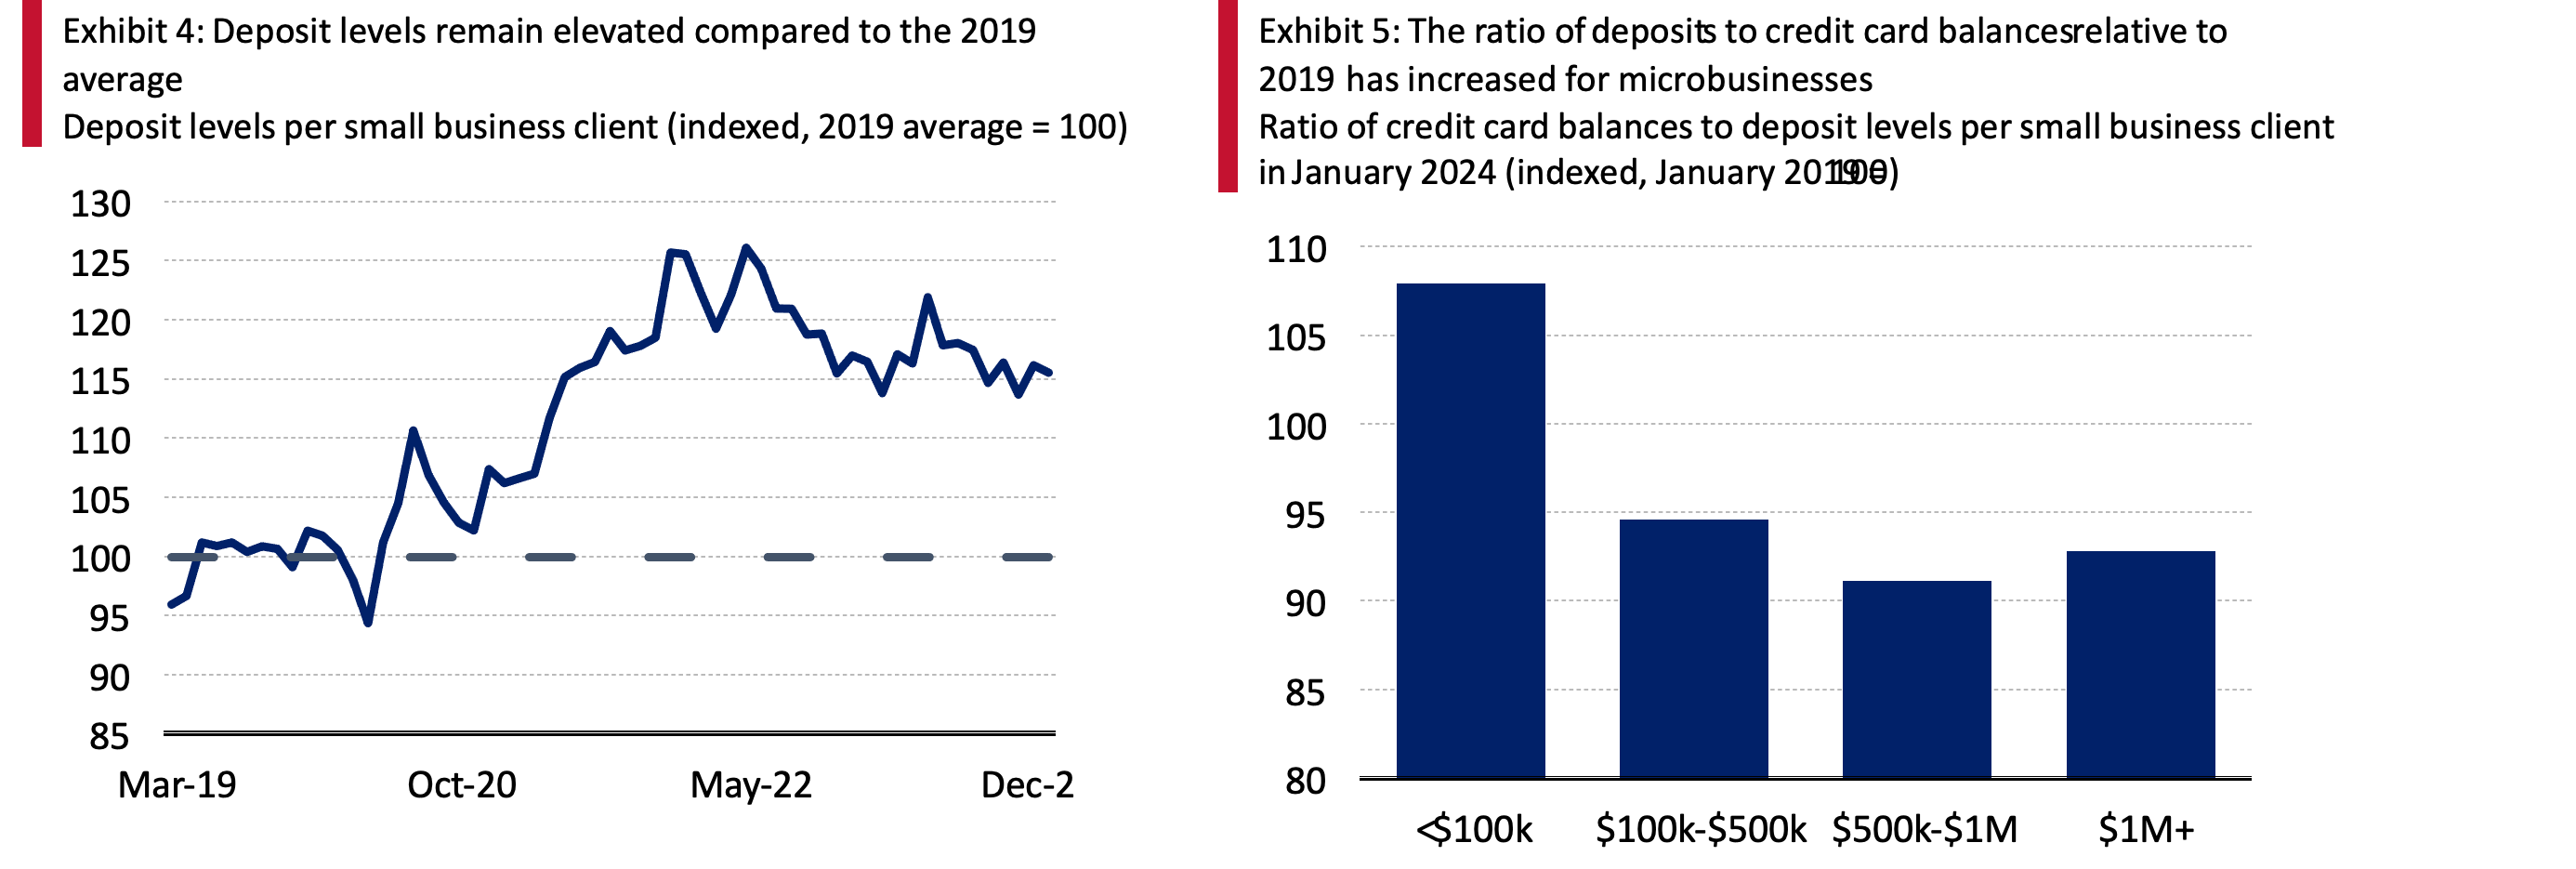
Exhibit 4 shows total deposit levels per small business client remain approximately 20% above the 2019 average. Across revenue tiers, Bank of America internal data shows that small businesses with annual revenue of <$100K (microbusinesses) have seen a rise in the ratio of deposits balances to credit card balances relative to January 2019 (Exhibit 5). These results show that microbusinesses, which are more likely to rely on credit cards than small businesses with a greater annual revenue, appear to be in relatively better financial shape.
MONTHLY PAYMENTS UPDATE
Looking more broadly at small business activities in January, we find total payments per small business client were up 1.0% YoY (Exhibit 6). Among the major components, ACH jumped 6.1% YoY in January. Conversely, the largest decrease %YoY was payments by check.
Across sectors, payments growth turned positive across the board in January (Exhibit 7). Most notably, Finance increased 6.7% YoY, after a decline of 3.2% YoY in December. Health Services and leisure-related businesses like Restaurants and Lodging were also fairly strong.
METHODOLOGY
Selected Bank of America transaction data is used to inform the macroeconomic views expressed in this report and should be considered in the context of other economic indicators and publicly available information. In certain instances, the data may provide directional and/or predictive value. The data used is not comprehensive; it is based on aggregated and anonymized selections of Bank of America data and may reflect a degree of selection bias and limitations on the data available.
Any Small Business payments data represents aggregate spend from Small Business clients with a deposit account or a Small Business credit card. Payroll payments data include channels such as ACH (automated clearing house), bill pay, checks and wire. Bank of America per Small Business client data represents activity spending from active Small Business clients with a deposit account or a Small Business credit card and at least one transaction in each month. Small businesses in this report include business clients within Bank of America and are generally defined as under $5mm in annual sales revenue.
Unless otherwise stated, data is not adjusted for seasonality, processing days or portfolio changes, and may be subject to periodic revisions.
Revenue tiers are determined by the combination of following factors: 1) stated revenue on small businesses credit or PPP applications, 2) actual account inflow into BofA Deposit Accounts, and 3) third party revenue estimation.
Data regarding merchants who receive payments are identified and classified by the Merchant Categorization Code (MCC) defined by financial services companies. The data are mapped using proprietary methods from the MCCs to the North American Industry Classification System (NAICS), which is also used by the Census Bureau, in order to classify spending data by subsector. Spending data may also be classified by other proprietary methods not using MCCs.
Additional information about the methodology used to aggregate the data is available upon request.
Treasure Coast Business is a news service and magazine published in print, via e-newsletter and online at tcbusiness.com by Indian River Media Group. For more information or to report news email news@indianrivermedia.com